Subscription analytics for Stripe
Your Stripe metrics, read the way a buyer will.
MRR, ARR, churn, retention, cohorts and customer concentration, rebuilt from your Stripe history, split by plan and kept current. Built for founders who may sell, so every report answers a question a buyer will ask.
Free while in early access. No card, no call.
Northwind Ledger · Trailing 12 months
Synced from Stripe
How fast is it growing?
ARR
$4.21M
↑ 31.4% vs last year
Do customers stay and expand?
Net revenue retention
104.2%
↑ 2.1 pts · GRR 88.6%
WATCH
Logo churn is 17.9%, above the 15% most acquirers question. Most of it comes from the Starter monthly plan.
Is it exposed to a few customers?
Top 10 share of MRR
22.4%
↓ 3.8 pts · largest 6.1%
How it works
Connect Stripe. See your business the way a buyer will.
No spreadsheets, no setup project. Runup does the analyst’s work for you, from data you already have.
-
01 · Connect
Link your Stripe account
Nothing to install, nothing to export. Runup reads your subscription history straight from Stripe.
-
02 · Rebuild
Your full history, rebuilt
Every signup, upgrade, downgrade and cancellation becomes a monthly MRR movement: new, expansion, contraction, churn and reactivation.
-
03 · Read
Dashboards built around a buyer’s questions
Growth, retention, plans, cohorts and concentration, each split by plan, with exports an analyst can check.
Inside Runup
Every report answers a question a buyer will ask.
This is the SaaS metrics dashboard you get after connecting Stripe. Each number leads to the report that explains it.
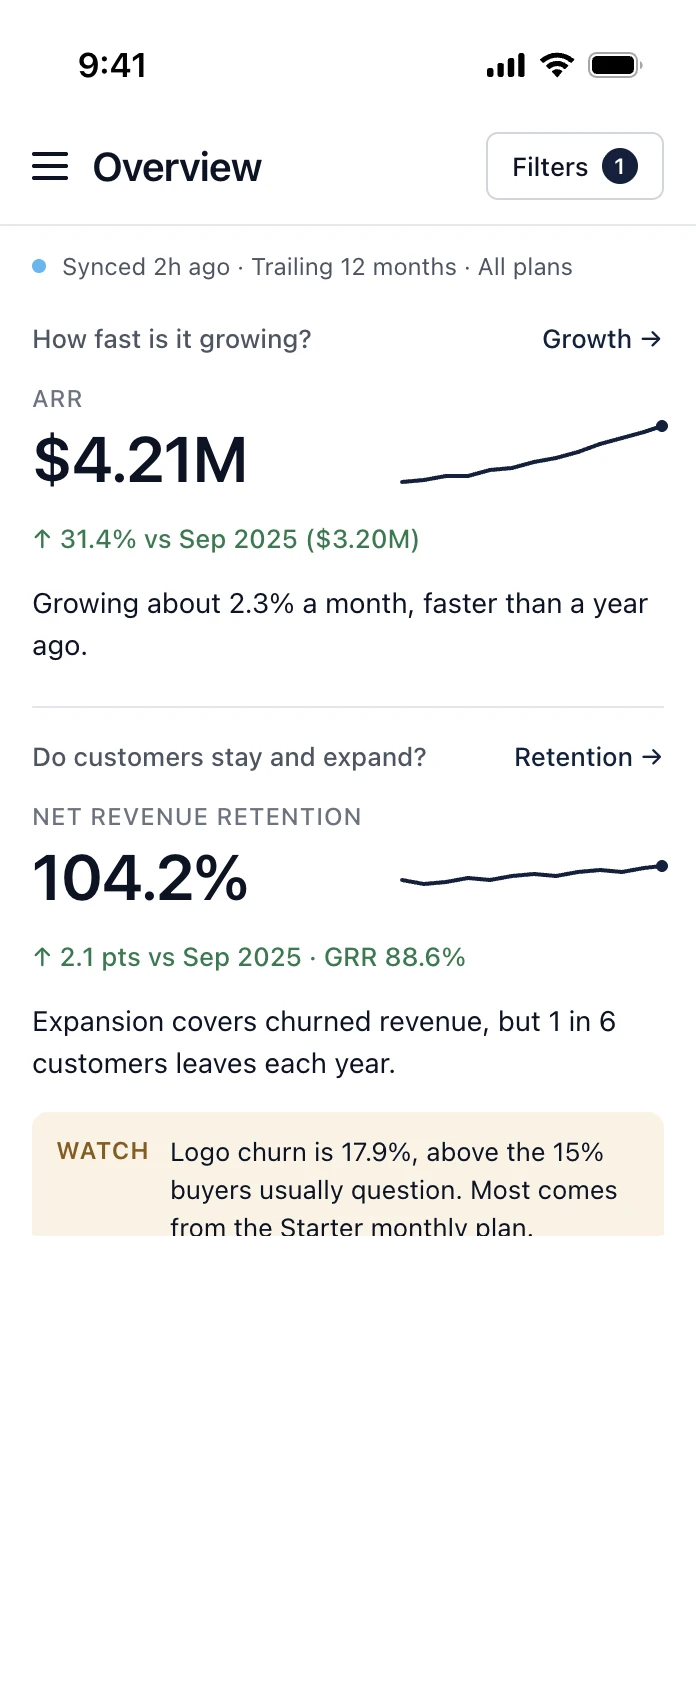
Three answers, before anyone asks.
Growth, retention and concentration up front, each with a plain-English read. Watch notes flag the numbers buyers question.
Three answers, before anyone asks.
Growth, retention and concentration up front, each with its trend and a plain-English read. Watch notes flag the numbers buyers question, and the chart shows what moved ARR every month.
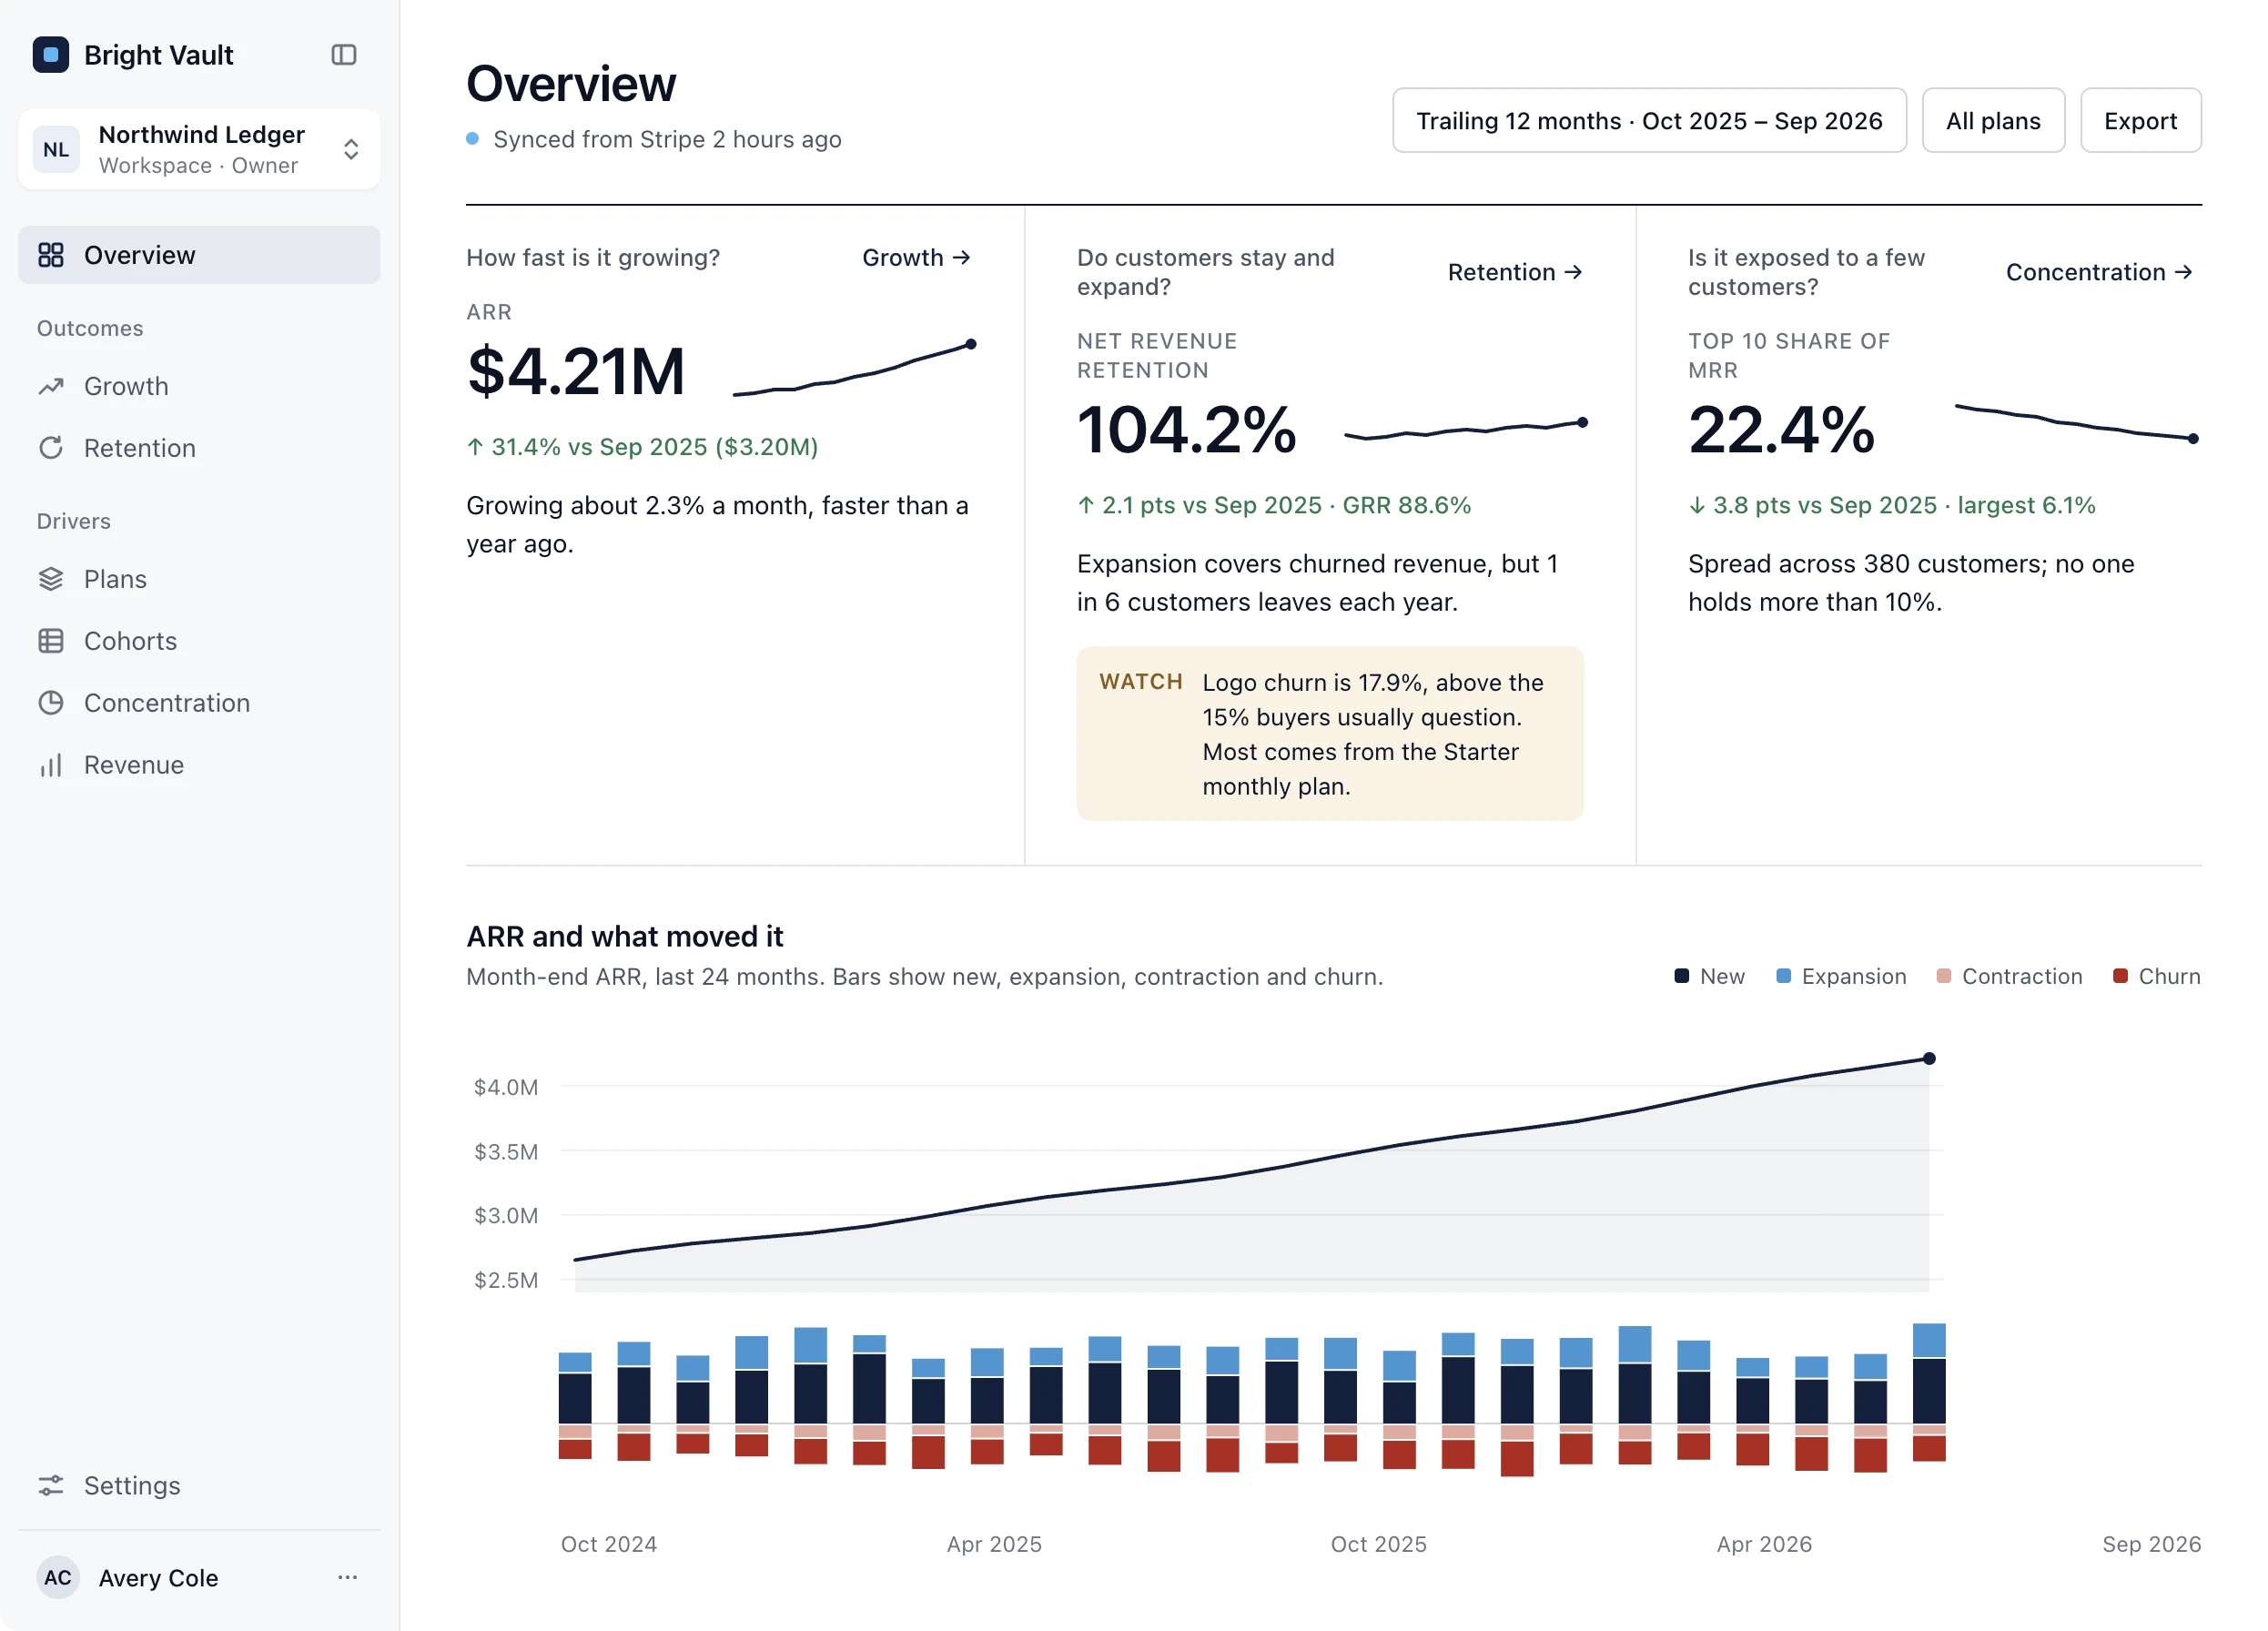
A trend, not a good month.
Trailing-twelve-month NRR and GRR over three years, each headline marked against where buyer questions start, and retention split by plan group.
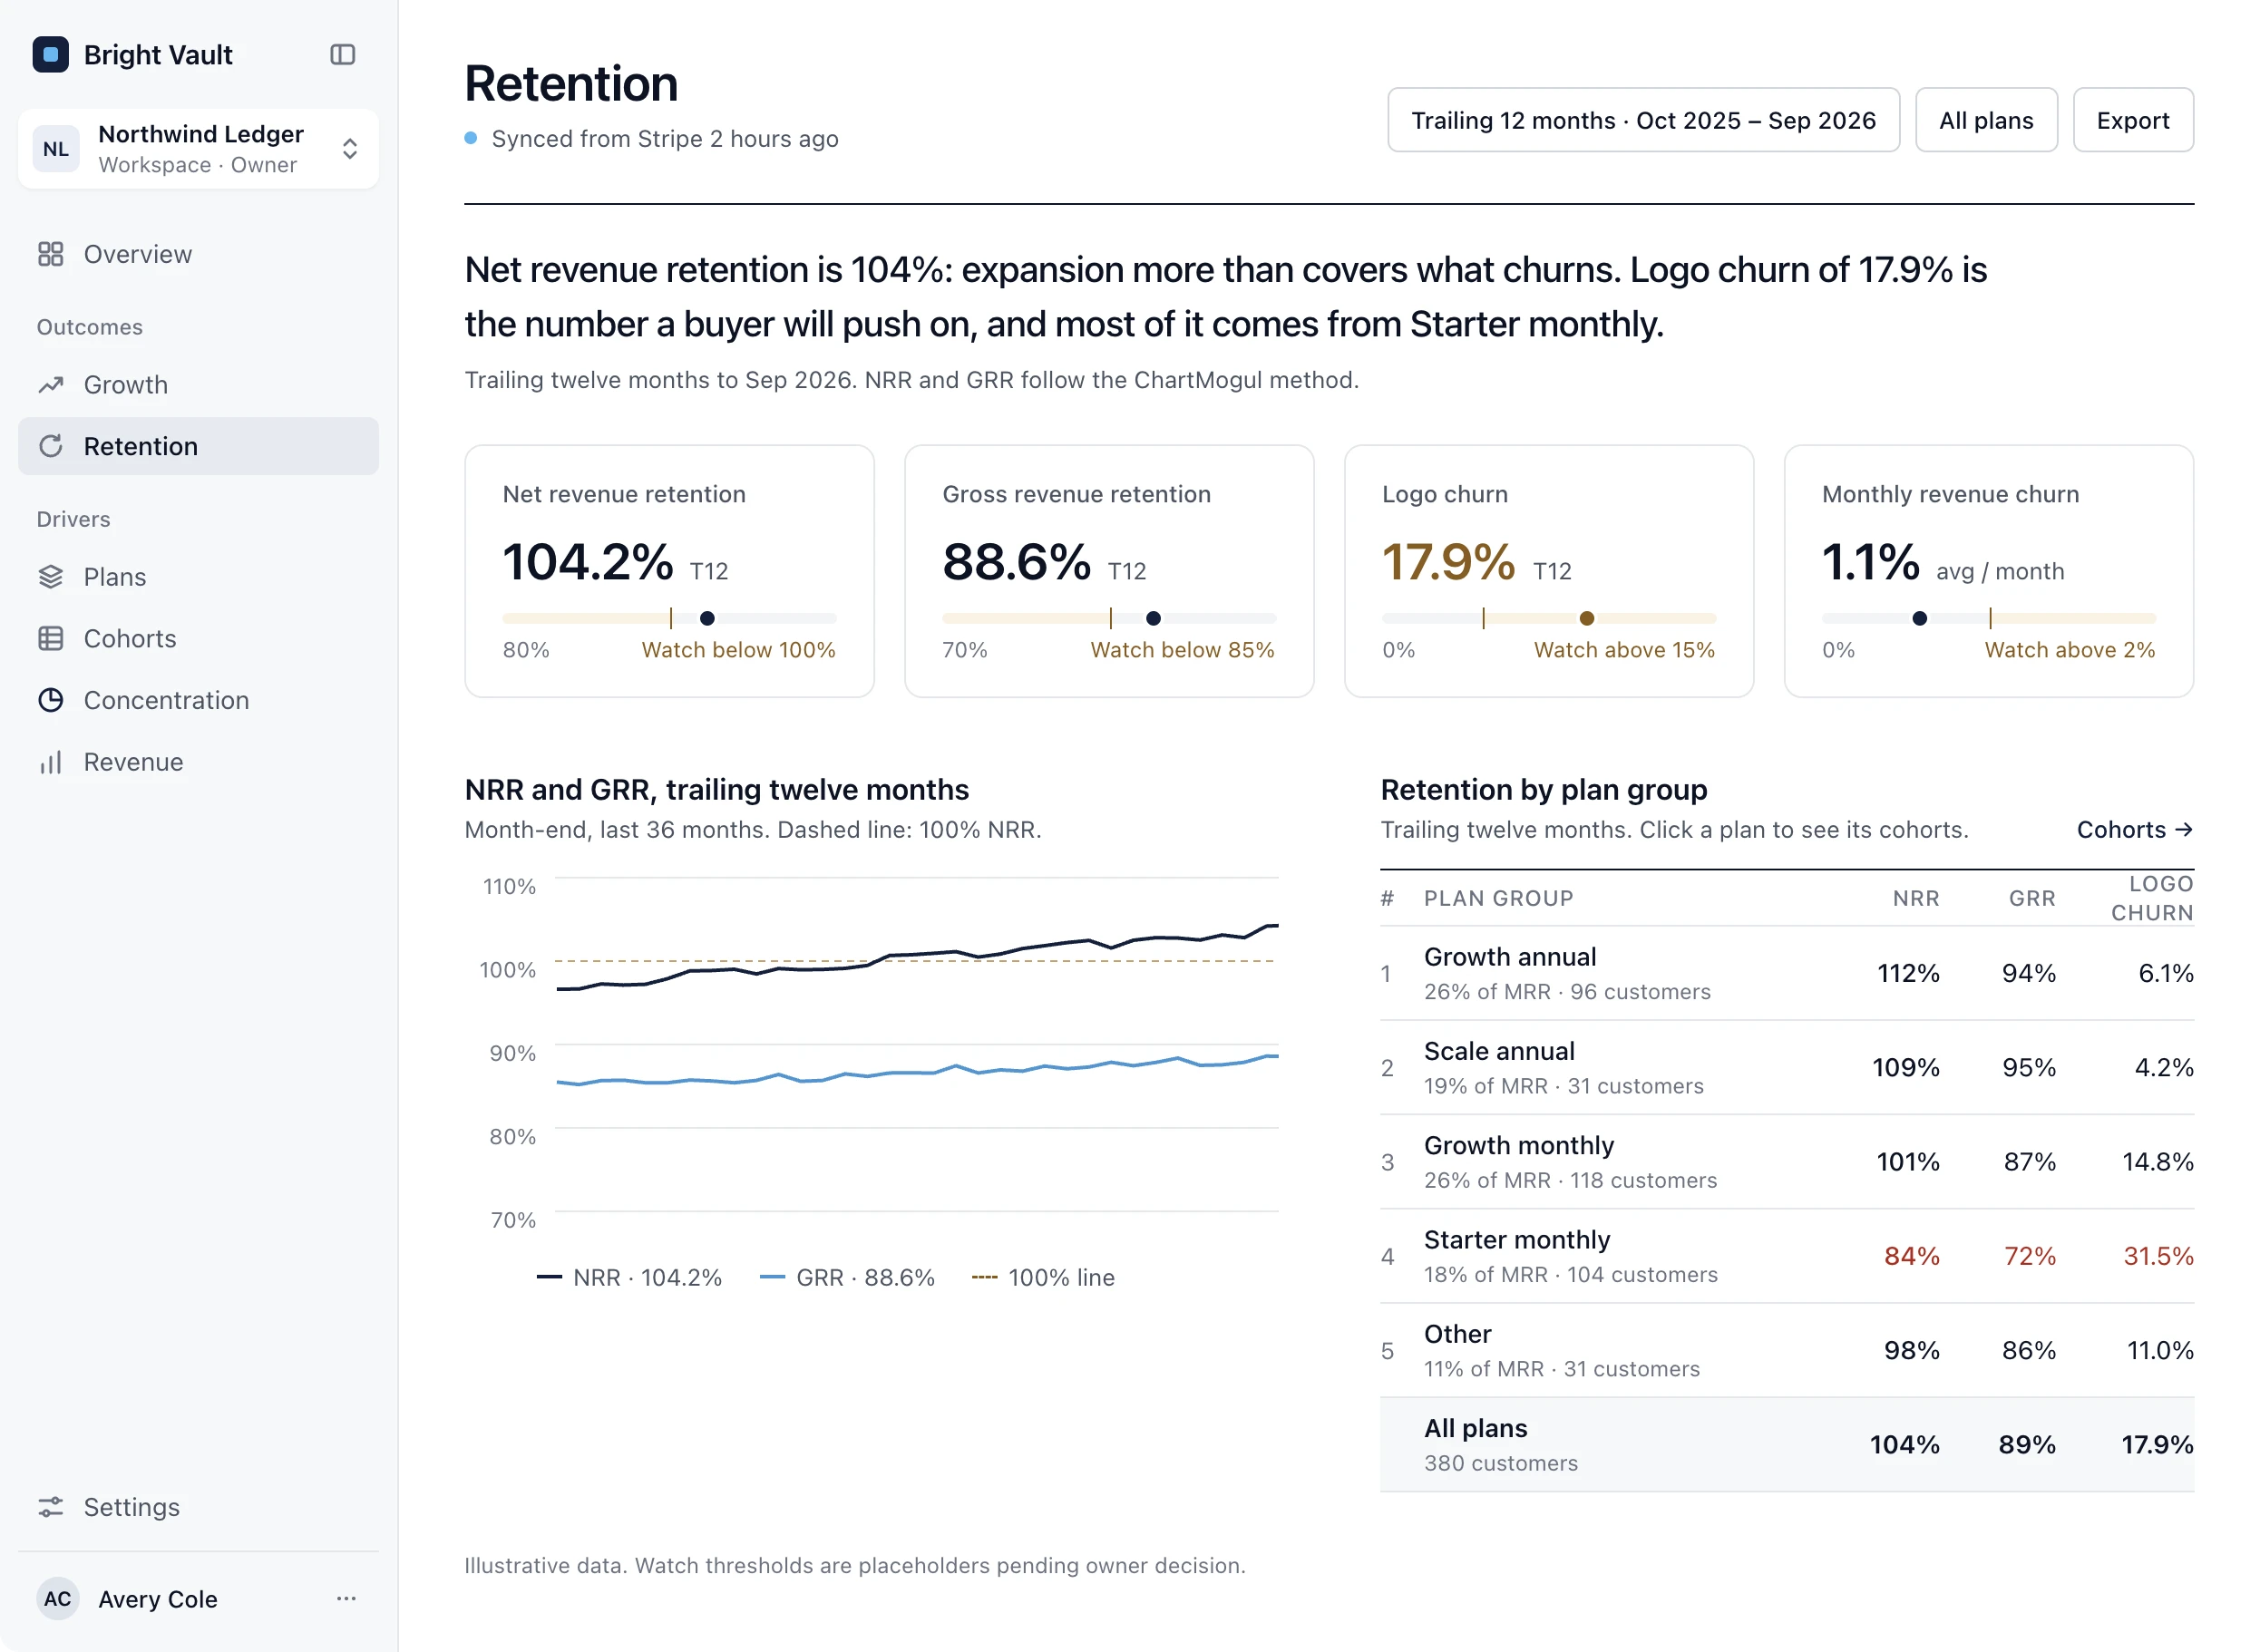
Which plans carry the business.
MRR, growth and NRR for every plan group with every Stripe price rolled up, the annual versus monthly mix, and the plans that are shrinking.
How much rides on a few customers.
Largest customer, top 10 and customers over 5% of MRR against a watch line, over three years, with every customer shown as a pseudonym.
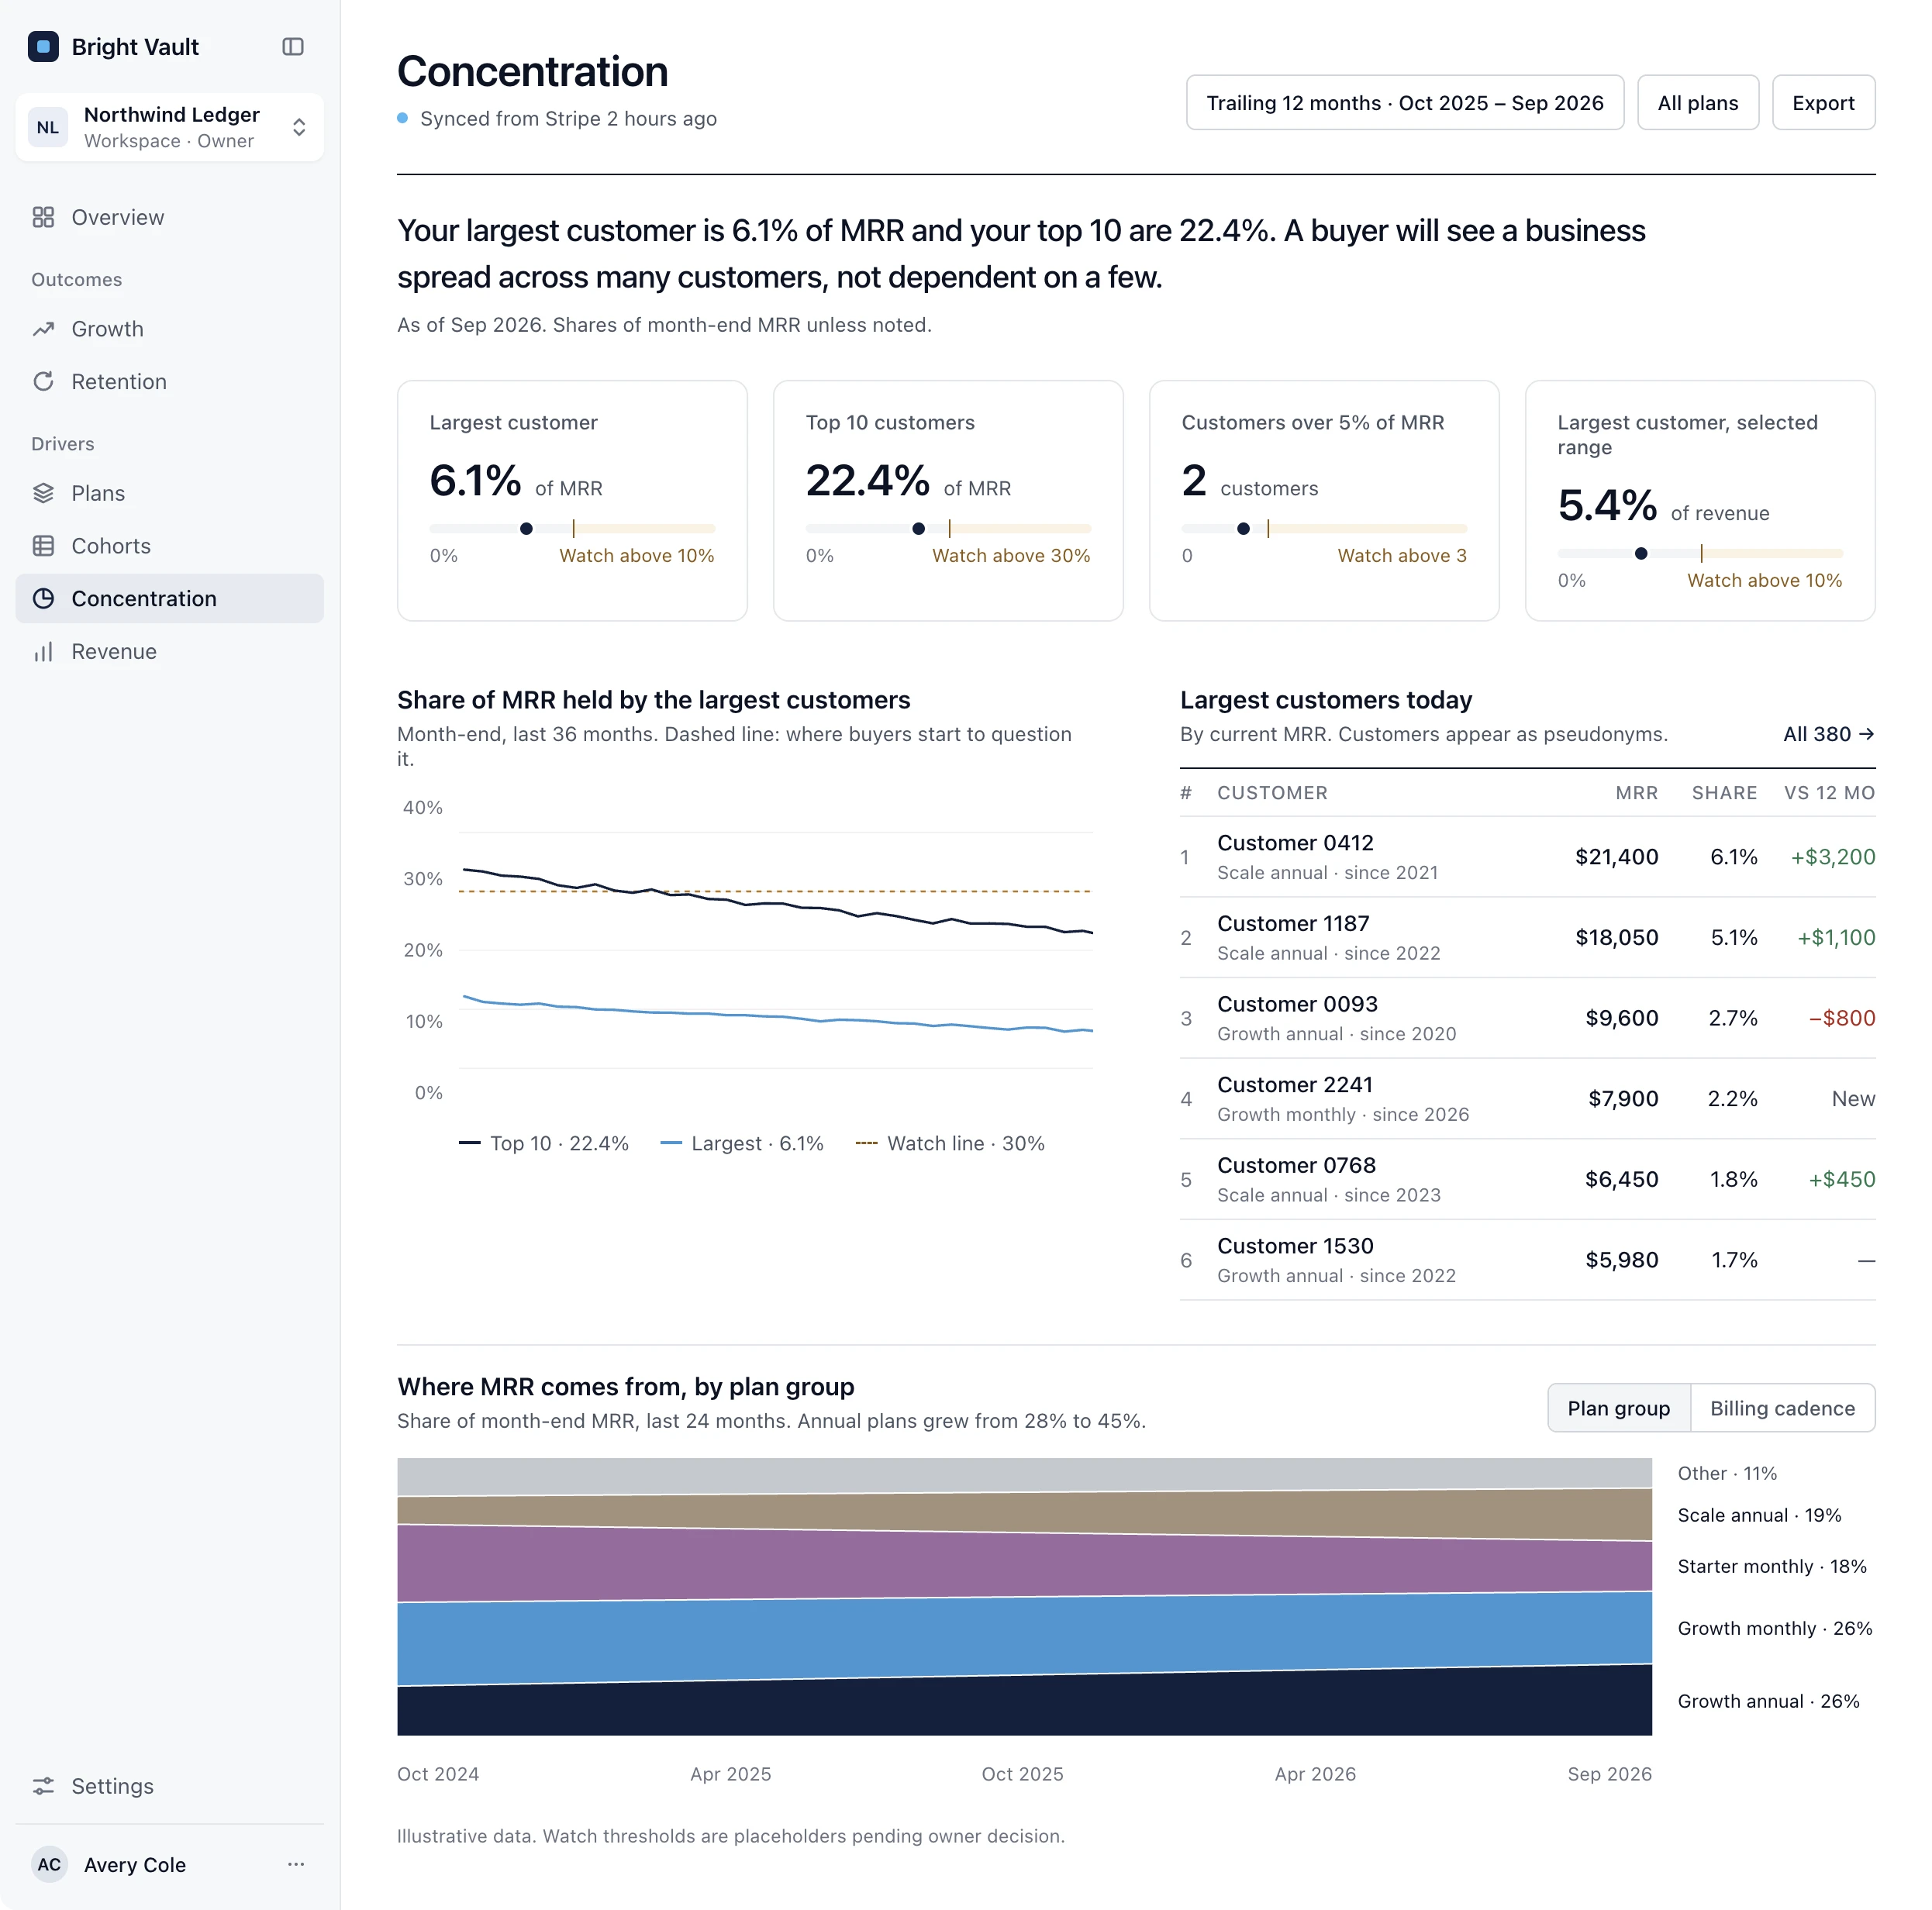
Sample company. Illustrative data; the flags in these screens use earlier placeholder thresholds, not Runup's current Watch lines.
What it shows
Every buyer asks the same five questions.
A headline number gets you a meeting. The follow-up questions decide the price. Runup answers them by plan, by cohort and by customer, before anyone asks.
- 01
Which plans carry the business?
Revenue, growth and retention for every plan group, with drill-down to individual prices and the flows between plans.
- 02
Is retention a trend or a fluke?
Trailing-twelve-month NRR and GRR, monthly churn and contraction, each one split by plan, movement type and billing cadence.
- 03
Do new cohorts hold up?
Logo and revenue retention by signup month and by year, and cohorts split by the plan customers started on.
- 04
How much rides on a few logos?
Top 1, 10 and 20 share of MRR over time, and every customer above 5% or 10%. Shown as pseudonyms, never names.
- 05
Annual or monthly money?
MRR and recognized revenue split by annual, monthly, usage and one-off, and how that mix is moving.
Numbers that hold up when someone else recomputes them.
Standard metric definitions
MRR, churn and movements use the standard SaaS subscription-metric definitions, with every known difference written down in the open.
Exports that tie out
The per-customer MRR schedule and ARR bridge reconcile to the totals on screen, so a spreadsheet check lands on the same number.
Customers stay anonymous
Reports are private to your team. Anything shared with an AI assistant shows customers as pseudonyms, never names or emails.
Free · Kept current from Stripe
See what a buyer would question.
Connect Stripe and Runup checks your growth, retention and customer concentration against the lines buyers usually question for your business model, which you set in Settings. When a number crosses one, the report flags it and says in a sentence what a buyer will make of it.
Overview
Watch lines for SMB B2B software
- Net revenue retention 81.6% Watch
- Top 10 share of MRR 22.4%
- YoY ARR growth 31.4%
- Logo churn (T12) 38.2% Watch
Watch
Net revenue retention is 81.6%, below the 85% line. Buyers see revenue that has to be replaced each year before the business can grow.
Watch
Logo churn is 38.2%, above the 35% line. Buyers usually price churn this high into a lower multiple.
Why it exists
“I spend my days reading other founders’ numbers. The story hiding in one plan, one cohort or one big customer always surfaces too late.”
“I built and ran a SaaS company. Now I spend my days reading other founders’ numbers, and the same thing happens every time: the story hiding in one plan, one cohort or one big customer shows up too late to fix. Runup is the read I wish they’d had years sooner.”
Selling in the next twelve months?
Add an advisor with the 12-Month Exit Readiness Program.
A consultation, not software. An advisor reads your numbers with you, writes a Fix Plan for what a buyer would push on, and checks your progress for a year. Founding cohort: $1,500.
See what a buyer would see, while you can still change it.
Free while in early access. No card, no call.